CAMMELOT
I built a town to see if AI can actually save Dutch healthcare.
The Dutch healthcare system is running out of road. GPs operate at just 62% of their capacity because nearly a third of their time goes to paperwork. Specialist wait times breach legal limits in over 38% of referrals. By 2035, the Netherlands will be short 301,000 healthcare workers - a gap so large that no amount of hiring can close it.
I built Cammelot because the debate about AI in healthcare is all claims and no math. Proponents say it will “revolutionize care”; critics call it hype - but neither side shows their numbers. I believe AI can restructure the entire industry, not just speed up emails. To prove it, we need a simulation that produces measurable results instead of theoretical arguments.
Cammelot is a virtual Dutch town where 45 citizens - small enough to trace every individual outcome, large enough to produce statistical patterns across 200 runs - live, get sick, and try to navigate a system hitting “care gridlock” (zorginfarct). By running this town 200 times, I can measure what happens when we overhaul the system instead of just adding a chatbot to the status quo.
Why I Built This (and My Bias)
I have worked in Big Tech for the last six years, so you should assume I have a bias toward AI. That is exactly why I built a town that could prove me wrong. In many parts of this simulation, the data shows that AI is not a universal fix and can even introduce new risks.
Proponents treat AI as a way to do paperwork faster; critics dismiss it as pure hype. Cammelot requires both sides to show their math. Instead of making vague predictions, I focus on outputs we can test, break, and repeat.
The Simulated Environment
Cammelot is populated by 45 citizens with names, ages, and medical histories drawn from CBS and RIVM data. It looks like a 1994 Super Nintendo game, but the logic is strictly factual, based on 2025 health data and NZa tariffs.

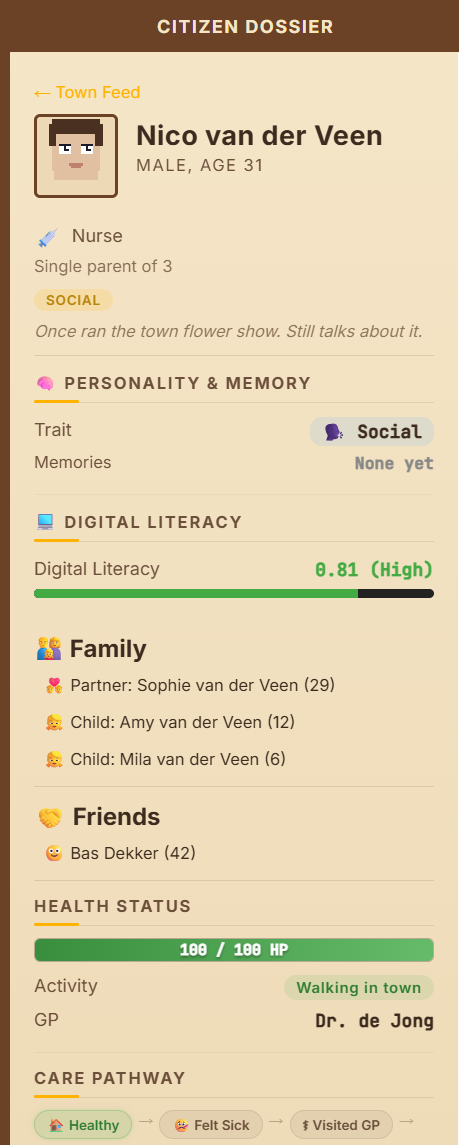
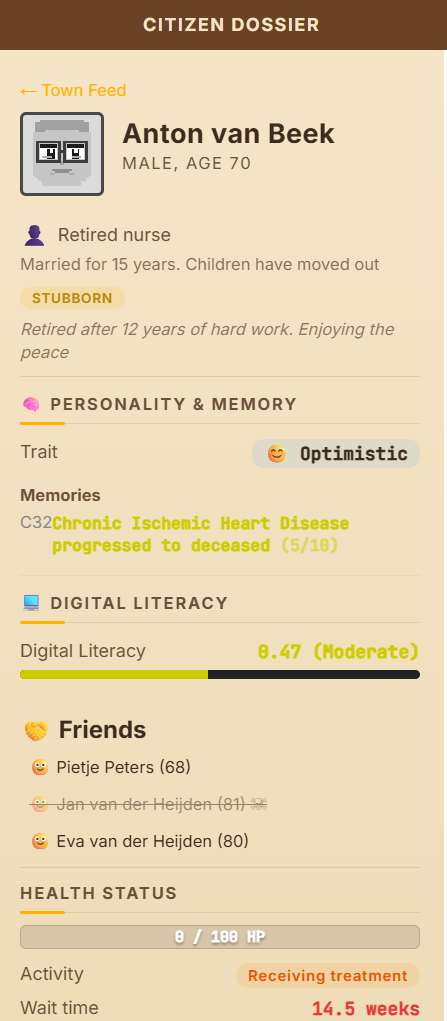
Citizen Dossiers: Every person has a profile including their job and digital literacy. These factors determine how they find care when they feel sick.
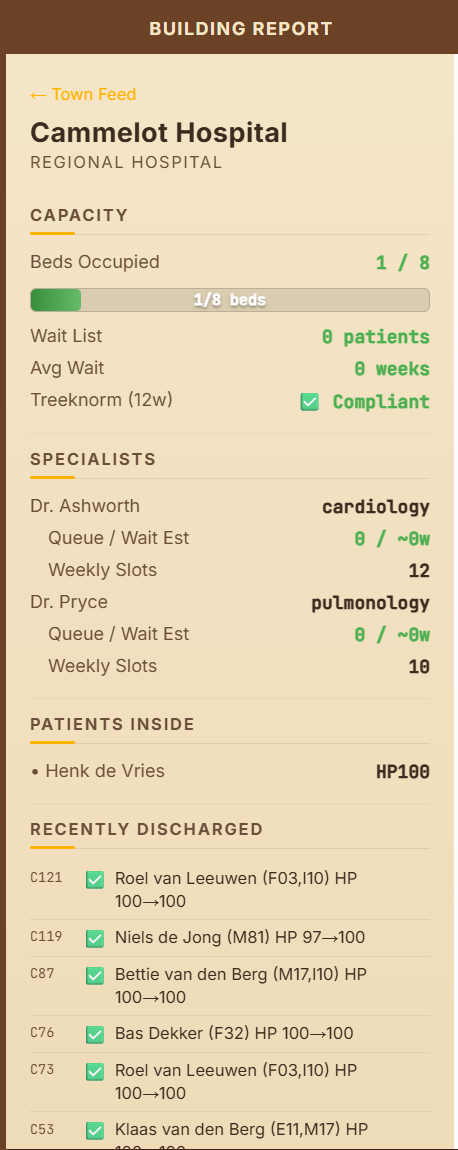
Hospital Reports: You can check live reports for the hospital to see how many beds are occupied and how long the specialist queues are.
Mortality Events: Citizens have health points (HP) that drain when they wait too long for a specialist. If HP reaches zero, the sprite turns into a ghost. The log will tell you exactly which bottleneck caused that preventable death.
The Crisis: The IST State (Today)
The IST state is our control group: the current Dutch healthcare system. We use real data from sources like the LHV to set the rules. In this mode, a GP operates at only 62% of their theoretical capacity. We calculate this using the effective capacity formula:
Ceff = Ctotal × (1 − admin − sick leave) × AI multiplier
In the IST state, 30% of time is lost to administration and 8% to sick leave. Because there is no AI assistance in this baseline, the AI multiplier is set to 1.0. This gives an effective capacity of just 62%. The ×1.0 exists in the formula so it can be compared to the SOLL state, where AI raises the multiplier to 1.34. The 12-week specialist wait shown below is not part of this formula - it is a consequence of it: when GPs can only use 62% of their time, referral queues back up beyond the legal Treeknorm limit.
Because a doctor is already overextended before seeing their first patient, the system creates the very complexity it cannot handle. Long waits lead to sicker patients, more emergency visits, and even more paperwork.
The Disease Engine
We use Markov models to track how a disease moves from “mild” to “critical.” For example, a 72 year old with diabetes and COPD is on a much steeper health decline than a younger person. We also model comorbidities: diabetes can double the risk of heart disease, and COPD makes heart failure 2.5 times more likely. A 12 week wait for a specialist hits these high-risk patients fundamentally differently than it does a healthy 35 year old.
The Fix: The SOLL State (The AI-Native Overhaul)
The SOLL state is a redesigned system where AI acts as the “connective tissue” between providers. This is about changing the plumbing, not just the interface.
IST (Today)
30% admin burden, 12-week specialist waits, fragmented data across isolated systems.
Effective capacity: 62%
SOLL (AI-Native)
Providers share Agent Cards, Digital Twins monitor continuously, admin drops below 5%.
Effective capacity: ~83%
Ambient AI Scribes: These tools record consultations and handle documentation in real time. This drops the admin burden from 30% to less than 5%.
Digital Twin Monitoring: Every citizen has a digital risk profile. The system can trigger a GP visit when a patient’s risk of heart failure hits 25%, rather than waiting for them to show up at the ER.
Agentic Mesh: Providers use “Agent Cards” to share their skills and wait times. This allows referrals to be booked via software agents in hours instead of weeks of manual calling and faxing.
Fairness Guardrails: We built in rules that prevent the AI from deprioritizing elderly patients just to make the “average” wait time look better.
Does It Actually Work?
Every claim is tested by running the simulation 100 times per state (200 runs total). We simulate ten years of healthcare activity in each run.
Because we only have 45 citizens, a single death can change the mortality rate significantly. We account for this “small-population variance” by reporting the average results across all 200 runs. This is the only way to identify if an AI intervention actually helps or if the results were just random chance.
Current Research Questions
I built Cammelot to move past the hype and ask specific questions:
- If we cut paperwork to 5%, do doctors see more patients - or does a new bottleneck appear?
- Does early risk detection through Digital Twins actually change the outcome, or just create more paperwork?
- Can an AI-native system bring specialist wait times back under the four-week legal limit?
Research Chapters
Each post below breaks down a different part of the Dutch system to see if it holds up under the pressure of the simulation.
| Post | Primary Question | Focus | Results |
|---|---|---|---|
| 01: The Admin Tax | Does cutting paperwork by 25% directly save lives? | GP Capacity & ROI | Soon |
| 02: The Waiting List | Why 12 week waits are mathematically age-discriminatory. | Treeknorm Impact | Soon |
| 03: Inequality Drift | Does AI triage make existing disparities worse? | Algorithmic Fairness | Soon |
| 04: The Digital Twin | Can proactive scoring prevent the “ER Cliff”? | Predictive Monitoring | Soon |
The Path Forward
Beyond the current health series, we will cover the technical architecture of the town, including FHIR memory storage, the A2A protocol, and the security red-teaming of the agents. The code for Cammelot is entirely open source and all simulation statistics are published for transparency.
I am looking for your great ideas and new research questions to dive into for future runs. If there is a specific policy, or technological intervention you would like to see stress-tested, please get in touch. I would love to see which hypotheses actually survive contact with a stochastic population.
Data Sources & References
- CBS - 172 duizend mensen overleden in 2024 (mortality statistics)
- CBS - Bijna een derde werktijd zorg gaat op aan administratie (~31% admin burden)
- CBS / AZW - Ziekteverzuim in zorg en welzijn 2024 (7.3–8.9% sick leave)
- CBS / VZinfo - Levensverwachting per leeftijd en geslacht (M: 80.5, V: 83.3 jaar)
- RIVM / VZinfo - Chronische aandoeningen en multimorbiditeit (96% of 75+ has ≥1 chronic condition)
- ABF Research / VWS - Prognosemodel Zorg en Welzijn (301,000 worker shortage by 2035)
- NZa - Maximumtarieven huisartsenzorg 2025 (€12.43 regulier consult, BR/REG-25136)
- NZa / Staat van VenZ - Overschrijding Treeknorm wachttijden (specialist wait time violations)
- LHV - Peiling Administratieve lasten huisartsen 2023 (GP admin burden survey)
- IZA / Rijksoverheid - Integraal Zorgakkoord 2023–2026 (€2.8B transformation budget)
- Chen et al. - Risk of cardiovascular comorbidity in COPD: systematic review. Lancet Respir Med 2015; OR 2.46 for CVD.
- ESC - 2021 ESC Guidelines on CVD Prevention in Clinical Practice. Eur Heart J 2021;42(34):3227–3337. Diabetes RR≈2.0, Hypertension RR≈1.8.
- Park et al. - Generative Agents: Interactive Simulacra of Human Behavior. Stanford/Google, 2023.